24 February 2025: Bring Your Own Data
“Bring Your Own Data” data visualization workshop
The bioDSC organizes a “Bring Your Own Data” data visualization workshop. In this workshop, we will offer help and guidance to turn your own dataset into insightful visualizations using ggplot2 in R. You are expected to bring your own table with data to work on, ranging from a small pilot experiment to large-scale experimental assays. We can help improving your existing plotting scripts, or build one from scratch.
The aims of this workshop are to help you with:
- Making (publication-quality) plots of your dataset
- Writing reusable scripts to generate more plots later with new datasets
- Becoming more experienced and confident in using
Randggplot2
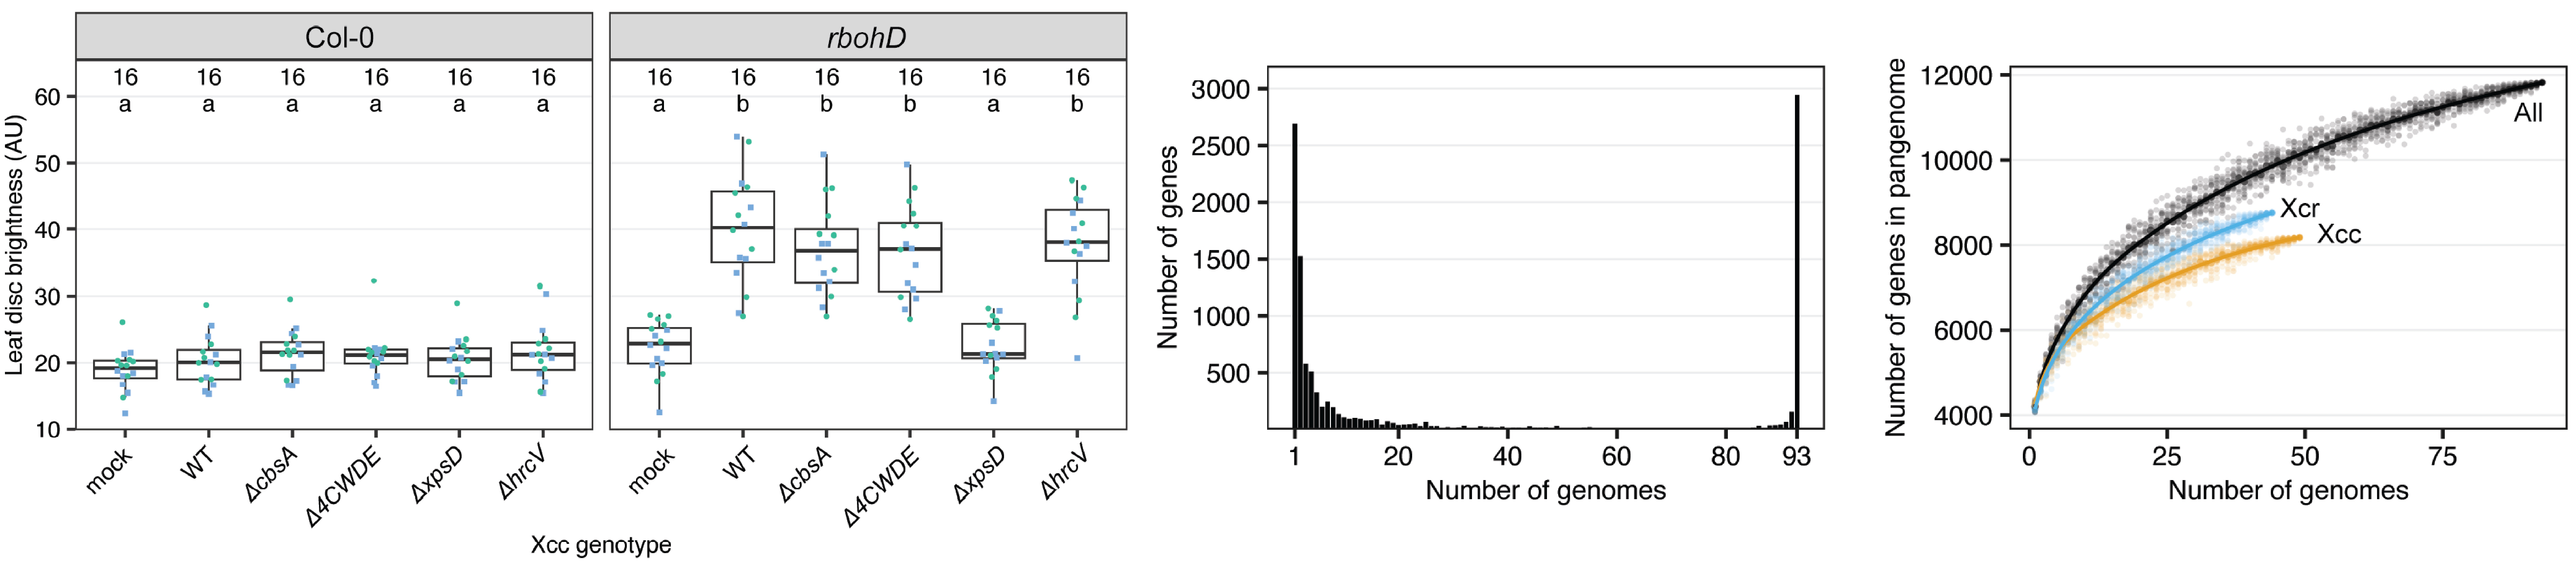
ggplot2, taken from Paauw et al, 2024.Prior experience
For this workshop, we assume that you have some experience with data manipulation and visualisation in R, using the tidyverse packages dplyr, tidyr and ggplot2. For example, you have followed our recent workshop Introduction to R where we covered the materials of R for Social Scientists. Alternatively, you have similar experience from other courses or your own explorations.
Workshop logistics
In this workshop, you will work by yourself on your own dataset. Martijn Wehrens, Misha Paauw, and Frans van der Kloet from the bioDSC will be available to discuss your approach and help you with all the problems you encounter along the way. There is room for 4-12 participants. You have to bring your own laptop, with and R and RStudio installed, including the tidyverse package.
Workshop schedule
| Date | Time | Location | Topic |
|---|---|---|---|
| Monday 24 february | 13:00 - 16:00 | Science Park B0.206 | Visualisation of datasets |
Sign up
Sign up by sending an email to info@biodsc.nl.
In your email, please include the following:
- Your research group
- Your dataset in comma separated, tab separated, or excel table format (
.csv,.tsv,.xlsx). - A brief explanation of your dataset and the plots you want to make
- Ideally, a quick sketch of the plot you want to make
Sign up deadline: 19th of february!